
Op het Data & Analytics Congres van 2 november jl. sprak o.a. Jason Brownlee van Colourtext. Hij presenteerde er Quant Semiotics, een data-analyse- en segmentatietool die grote datasets, die bestaan uit natuurlijke taal kan analyseren. De tool werd toegepast op zo’n 29.000 nieuwsartikelen over de onderzoekssector om zo de ontwikkelingen van het vak tussen 2005 and 2021 in kaart te brengen en op het spoor te komen van innovaties. Daily Data Bytes vroeg Jason Brownlee om zijn verhaal in een artikel te vatten.
Quant Semiotics excels in handling massive datasets where words transform into numerical entities. Traditional text analysis methods are ideal for smaller datasets like focus group transcripts, but when dealing with immense volumes of data, Quant Semiotics stands out. It uncovers hidden gems within sprawling web content, from news portals to endless social media comments.
Drawing inspiration from complex systems theory, Quant Semiotics investigates networks of interconnected concepts and ideas within text content. In these massive datasets, individual word meanings lose prominence, while statistical dynamics—the patterns—of keyword interactions emerge into focus. This might challenge conventional wisdom, but it offers powerful insights beyond traditional analysis.
Future-scoping potential
Our exploration of Quant Semiotics led us to focus on our home industry—the Data Analytics & Market Research sector. Our goal wasn’t just to study trends in our sector but also to investigate the future-scoping potential of this approach.
To achieve this, we compiled a substantial dataset of news articles spanning two decades. The data originates from MRWeb.com, a well-known web portal covering the Market Research and Data Analytics industry.
This research is significant both methodologically and for its insights into our industry’s development. The dataset encompasses around 29,000 news articles, each approximately 500 words long, totalling nearly 9,000,000 words. While the initial years of the dataset had some irregularities, the more recent 17-year period from 2005 to 2021 forms a stable foundation for our analysis.
Nodes in our netwerk
Our methodology centres on the intricate web of relationships among crucial market concepts, ideas, and innovations present in this extensive record of industry news. Constructing this network begins with a semi-automated curation process where we identify and extract keyword phrases with statistical significance. These phrases serve as nodes in our network, forming the basis of our analysis.
When multiple significant keywords co-occur within the same news article, we label it as a co-occurrence. For example, if an article mentions ‘Machine Learning’, ‘Data Visualization’ and ‘Customer Experience’ together, these keywords are said to co-occur.
Each co-occurrence instantiates an association or relationship between the keywords involved. Sufficiently frequent co-occurrence between two keywords indicates a robust real-world relationship within the market.
Landscape
We aggregate these co-occurrence instances across the entire dataset, creating a vast network of keyword relationships. This network evolves as new articles are published. Emerging keywords gradually form connections with established ones, influencing the network’s structure. Keywords gain or lose connections as trends rise, mature, or decline within the industry. The network mirrors the industry’s ever-changing intellectual landscape, capturing the flow of ideas and concepts.
By monitoring co-occurrence patterns over time, we identify emerging trends and anticipate the trajectory of ideas. This process relies on analysing network topology—the structure and connections between keywords in the network. Let’s look at how we use this keyword network’s topology to track trend evolution within the industry.
Analysing keyword relationships
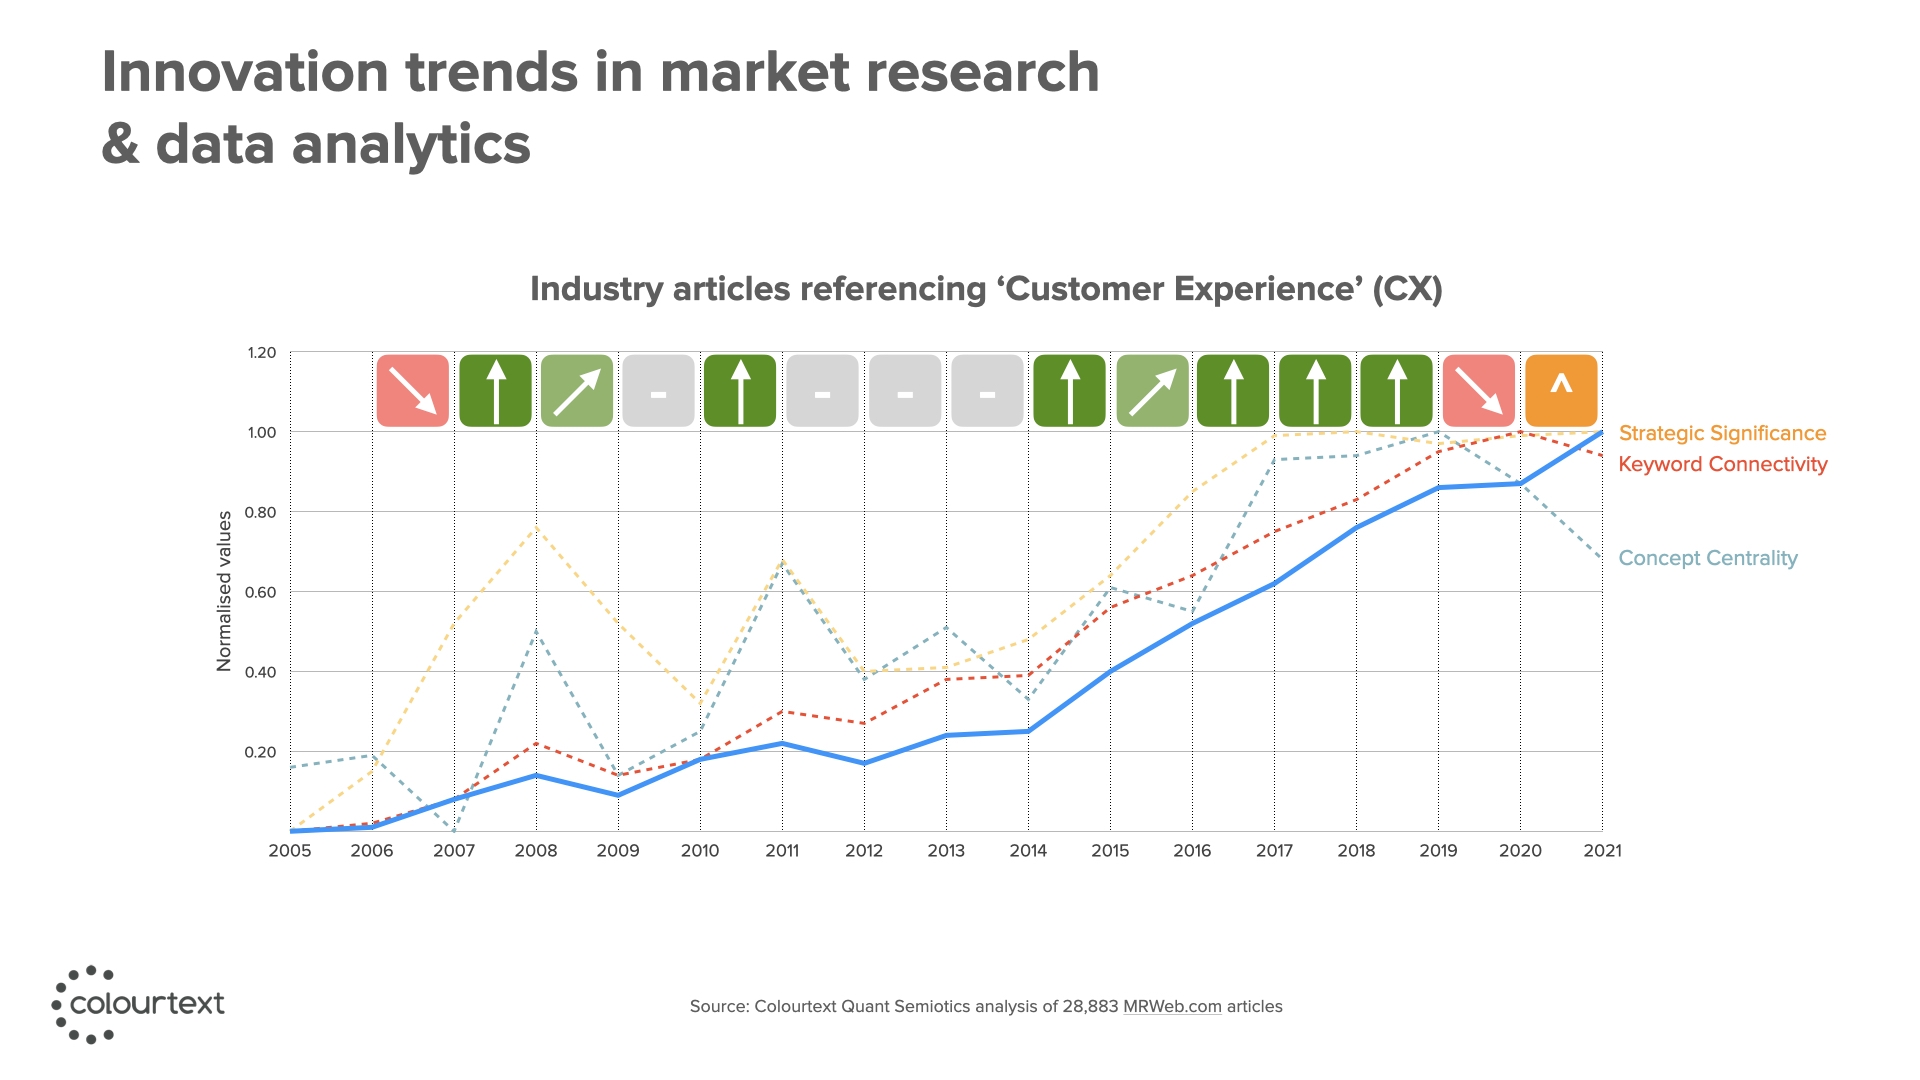
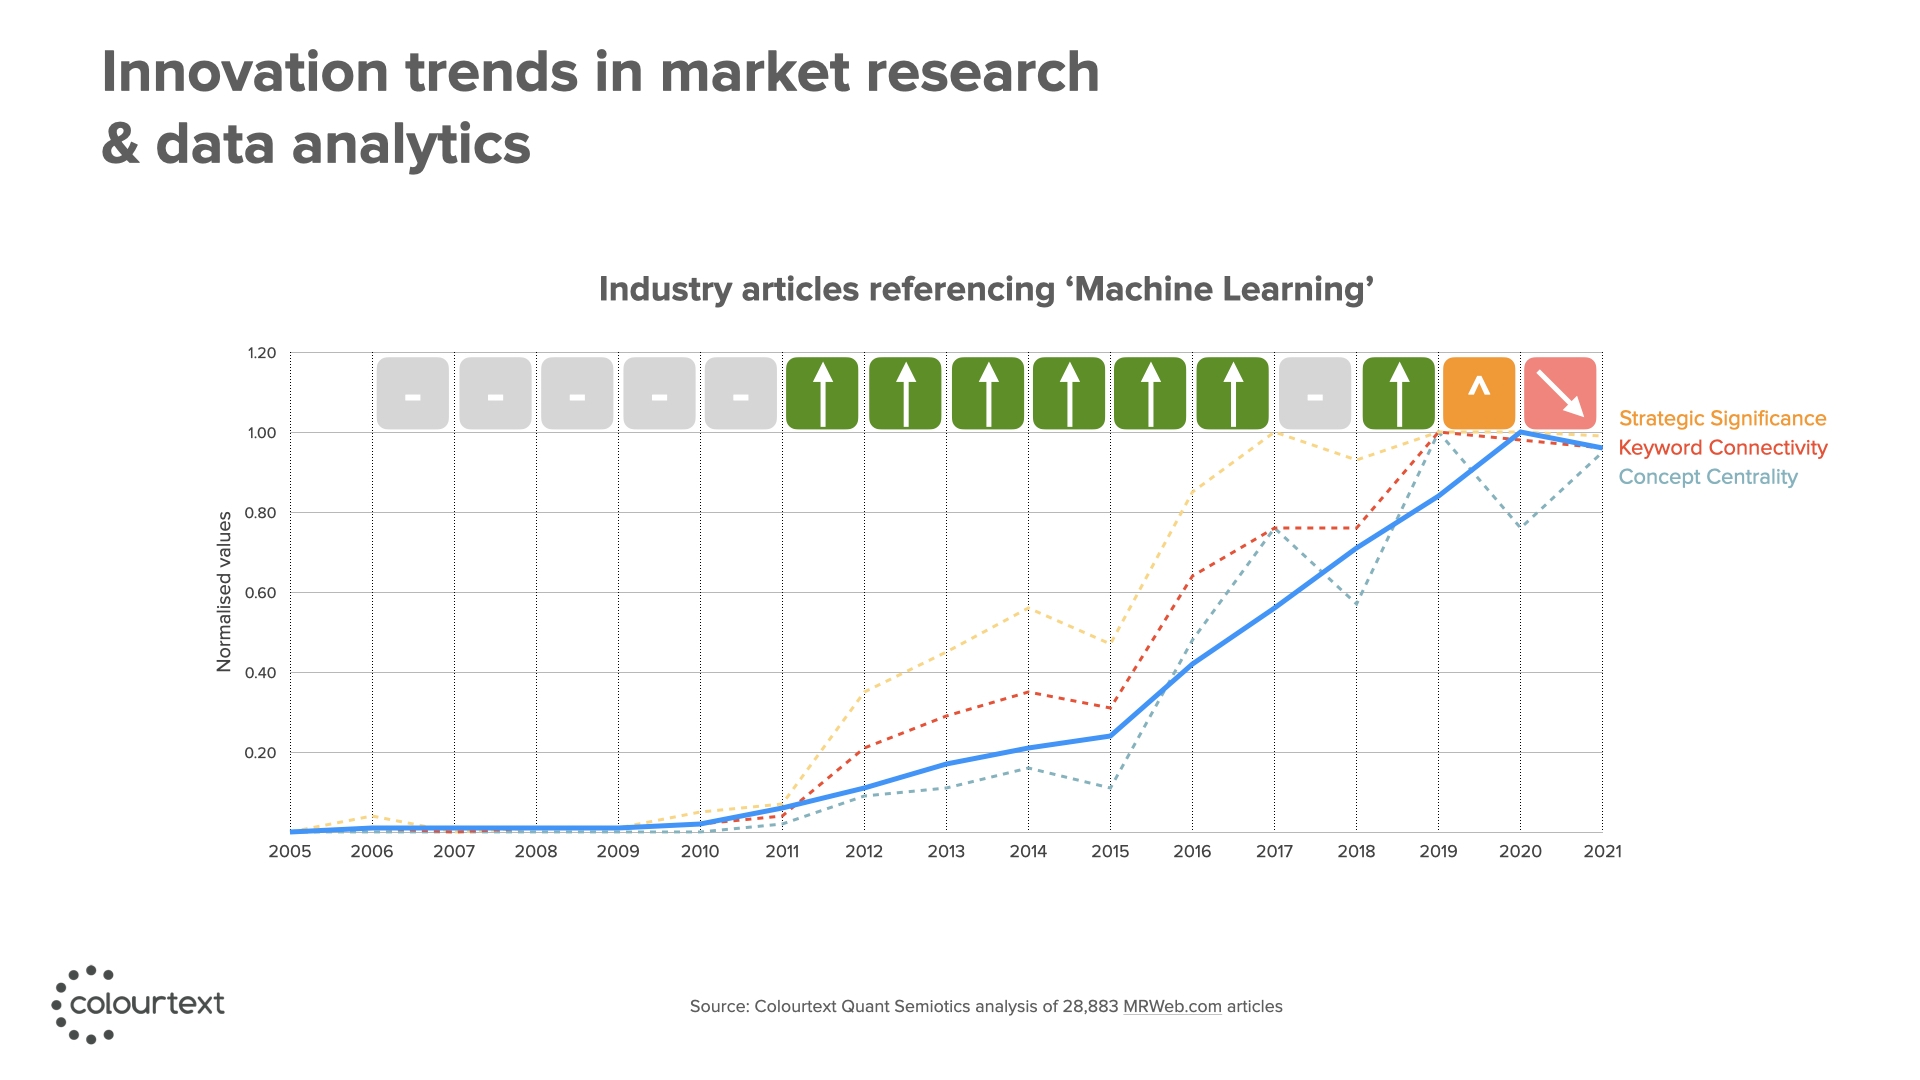
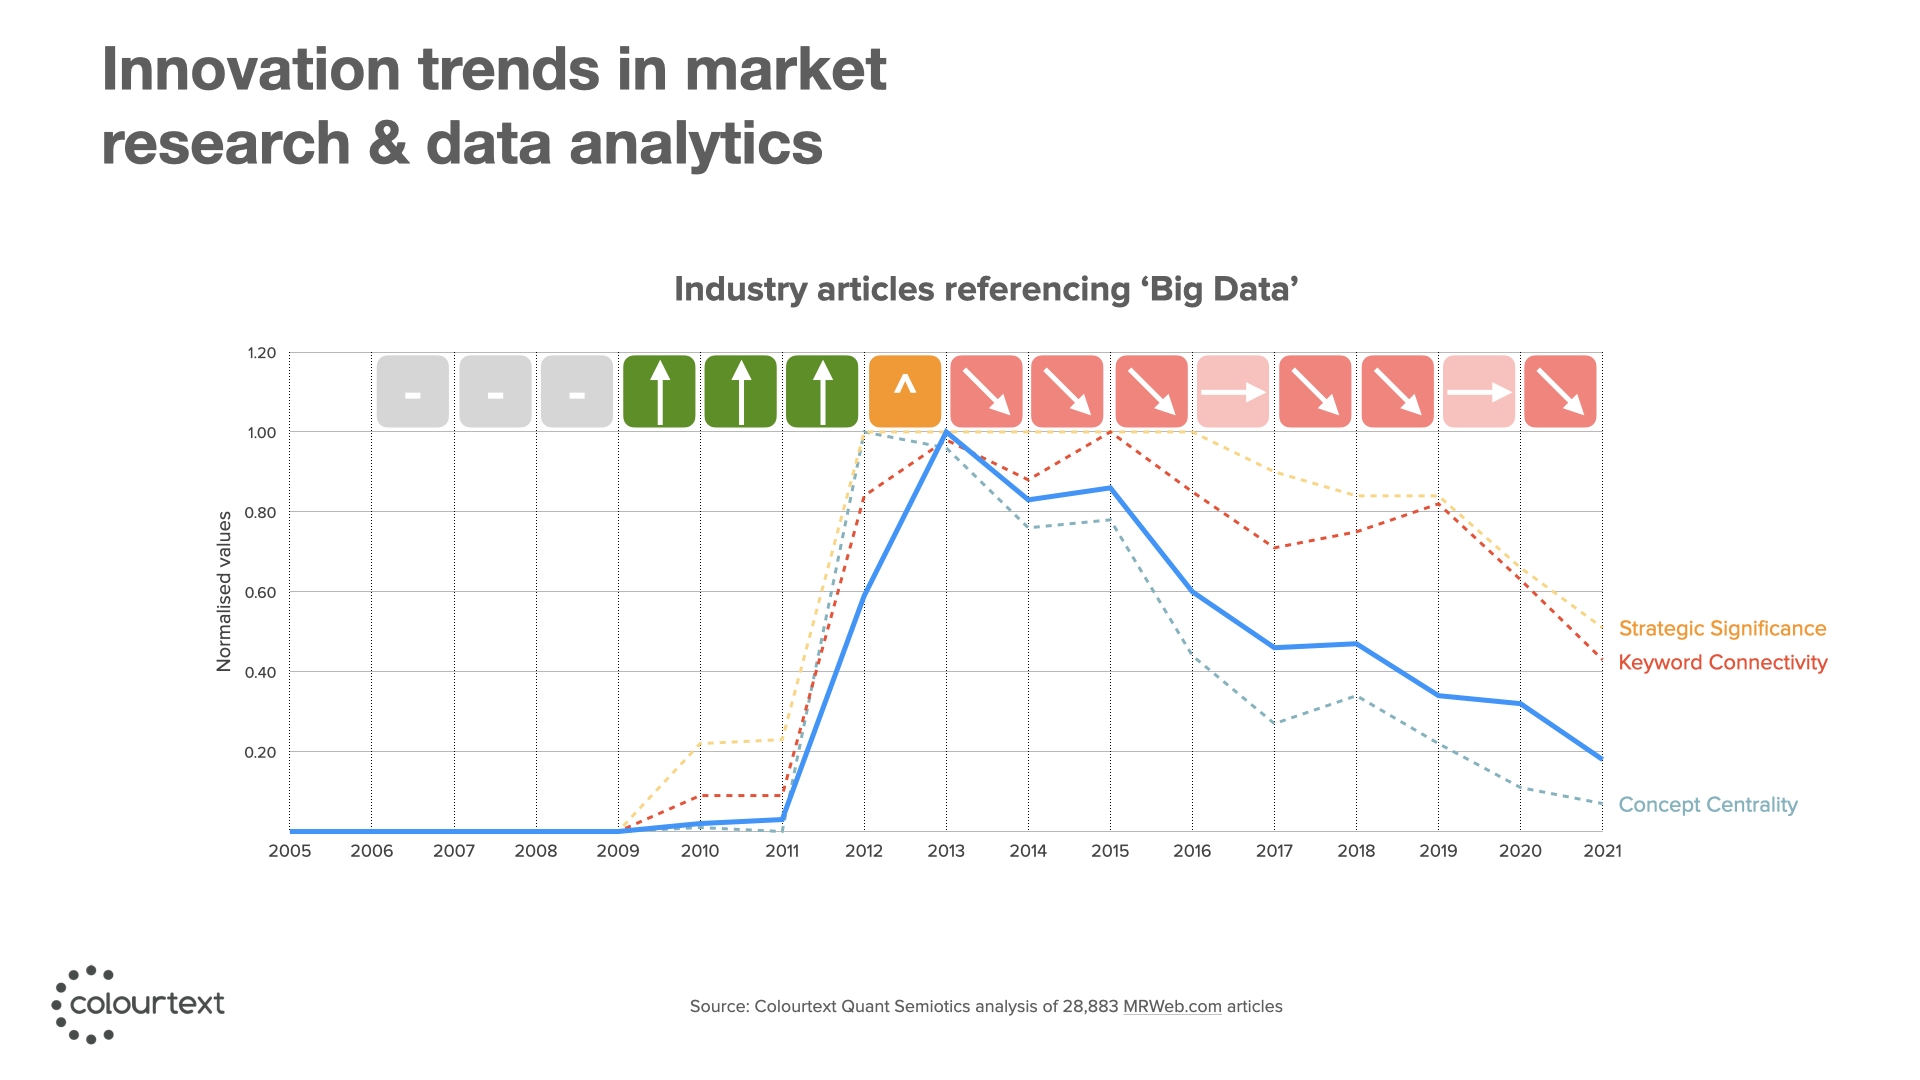
Our methodology revolves around three key network topology metrics: keyword connectivity, strategic significance, and concept centrality.
Keyword Connectivity
This metric quantifies how many distinct keywords a specific keyword is connected to within the dataset. Over time, if a keyword co-occurs with an increasing number of important concepts, its Keyword Connectivity score rises. This suggests the keyword is gaining prominence in the market, often signalling future popularity.
Strategic Significance
Strategic significance assesses a keyword’s importance through associations with other significant concepts or keywords. It considers both the quantity and quality of connections. If a keyword starts appearing alongside critical industry ideas, it gains strategic significance. Monitoring changes in strategic significance helps us spot trends gaining strategic importance within the industry, signifying their growing influence.
Concept Centrality
Concept centrality measures how crucial an innovation or concept has become in the market. It depends on a keyword’s position within the network. When an idea occupies a central role within a network, it indicates that it has become a focal point of discussion. As an innovation gains centrality within industry discourse, it influences and reshapes other ideas and themes, triggering realignment among existing concepts. Increasing concept centrality shows that a keyword has become a focal point of industry debate, influencing other ideas and themes. Conversely, decreasing centrality suggests a decline in a keyword’s market influence, indicating a downward trend in market salience.
How trends evolve
By scrutinizing these network metrics over time, we gain a comprehensive understanding of how trends evolve within the market. This approach enables us to anticipate which trends are gaining traction, consolidating or fading. It provides valuable insights for businesses, helping them make informed decisions about resource allocation and strategic focus, particularly in the context of new product and service development.
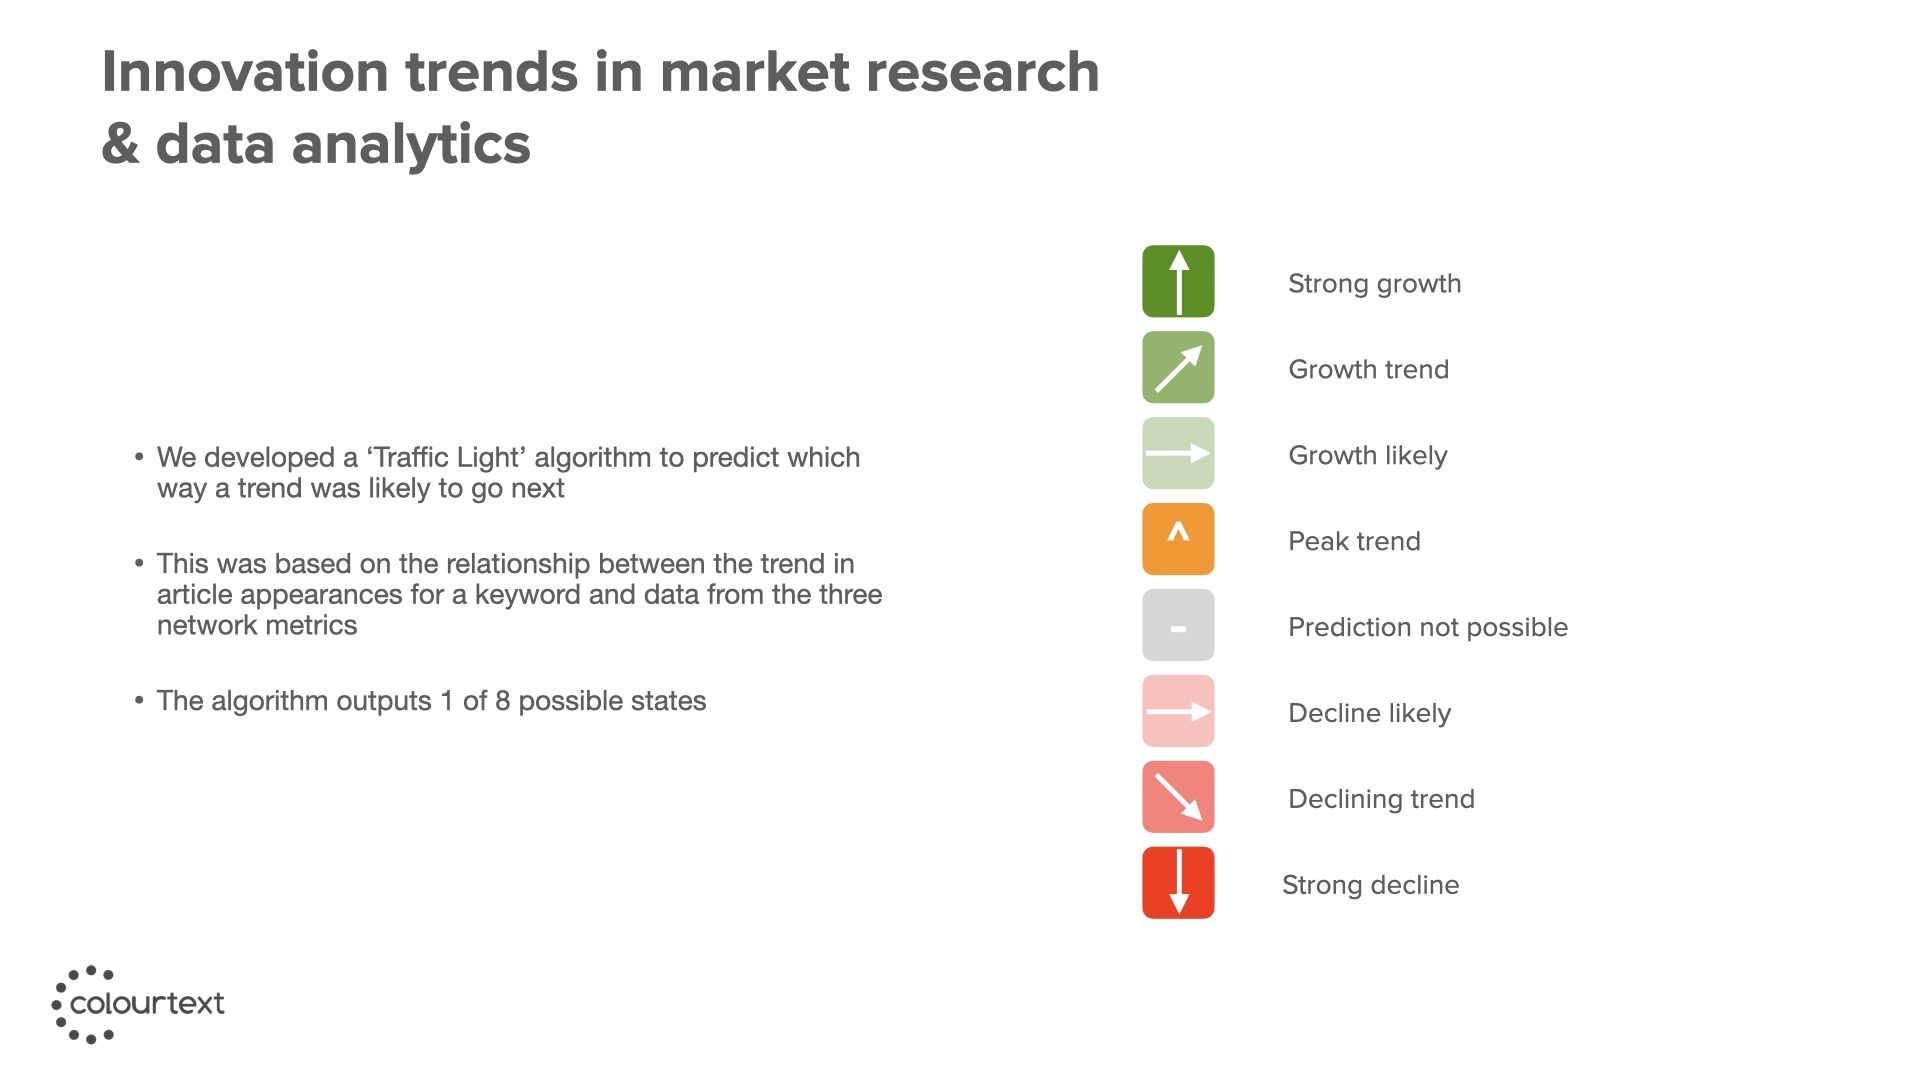
Traffic light algorithm
Now, let’s introduce our predictive ‘Traffic Light’ algorithm—a crucial component of our Trend Forecasting approach. This algorithm the network metrics data to make trend forecasts for each keyword. The algorithm assigns one of several possible ‘traffic light’ states to each keyword, indicating whether it is likely to experience growth, decline, or stability over various time horizons:
Green: This state signifies a concept or innovation is likely to experience growth and increased popularity in the future.
Yellow: Keywords assigned to this state exhibit some positive indicators, but there is a degree of uncertainty about their future trajectory.
Red: In this state, keywords have weak connectivity or declining influence, suggesting potential decline in market relevance or prominence.
Reliability
Evaluating the algorithm’s reliability has been a critical element of the project. Our findings indicate the algorithm predicts trends approximately 72% of the time, signifying a reasonably high prediction frequency. However, in about 28% of cases, the algorithm refrains from providing a forecast due to a lack of confidence.
The algorithm generates predictions for various time horizons, offering users flexibility for effective planning and strategizing. Remarkably, it’s better at forecasting trends four to five years into the future, achieving an average success rate of around 80%.

Auteur: Jason Brownlee, Founder of Colourtext.